[코드 분석]
모듈 불러오기
import numpy as np
from tensorflow.keras.models import Sequential
from tensorflow.keras.layers import Input, Dense
from tensorflow.keras import initializers

# y = 3*x1 + 5*x2 + 10
[모델 생성]
input data가 2개
hidden layer의 뉴런 16개
따라서 2*16 + 16(bias) = 48개입니다.
def generator_sequential_model():

    model = Sequential( [
    Input(2, name = 'input_layer'),                             #첫 Layer에서 2개의 변수로부터 값을 받고
    Dense(16, activation = 'sigmoid', name = 'hidden_layer1' ) ,# 뉴런 16개에 전달 , 시그모이드함수 사용
    Dense(1, activation = 'relu', name = 'output_layer')        # 하나의 y값 받아냄
])
    #print(model.layers[0].get_weights())                       # w1 : weight 값 출력  -> 계속 변함
    #print(model.layers[1].get_weights())                      # w2 : weight 값 출력
#     model.summary()
    model.compile(optimizer = 'sgd', loss = 'mse')
    return model


generator_sequential_model()
linear regression 모델링
-
Sample Data 생성
데이터 개수 >= [weight(파라미터)개수/ (1-정확도)]
65 / (1-0.9) = 650
따라서 650개 이상의 sample data 랜덤으로 설정 -
w1, w2, b 가중치와 bias 설정
-
X : 샘플 데이터 랜덤으로 x1, x2 각 각 650개 생성
-
회귀계수(w1, w2) 행렬화
-
matmul통해서 X와 coef 행렬
-
sample data 통한 y 구현
def generator_linear_regression_dateset(numofsamples = 650,w1 = 3, w2 =5, b=10):
    np.random.seed(0)
    X = np.random.rand(numofsamples,2)         # 입력값을 랜덤으로 650개 생성
    coef = np.array([w1,w2])
    bias = b

    y = np.matmul(X,coef.transpose()) + bias    #matmul : 행렬곱
    return X, y

# generator_linear_regression_dateset()
[fit 함수]
- X, y 데이터 입력
- epochs : 몇 번 scan하며 모델을 만들지 결정 (충분히 주어야 학습이 된다.)
- verbose : 실제 training 할때의 과정에서 loss 값을 표현
- validation_split : 전체 데이터를 자체적으로 Train / Test 데이터로 나누어줌 ( 할당 값=a 이면, Train : 1-a만큼 사용 , Test에 a만큼 사용)
1) model 구성
2) data smaple 만들고
3) 구성한 모델에 대해서 data sample 통해서 Training -> fit 함수 이용
model = generator_sequential_model()
X,y = generator_linear_regression_dateset(numofsamples = 1000)
history = model.fit(X, y, epochs =30, verbose =2 , validation_split = 0.3)
[output]

[plot_loss_curve Graph]
- history에 따라 나오는 값들(epoch가 증가함에따라 loss의 변화량) 그래프로 알아보기 위한 함수
- figure : 크기
- 각 loss들을 plot
- 제목 x,y축 이름
- 각 곡선의 이름 라벨링
import matplotlib.pyplot as plt

def plot_loss_curve(history):
    plt.figure(figsize = (6,4))

    plt.plot(history.history['loss'][1:])
    plt.plot(history.history['val_loss'][1:])

    plt.title('model loss')
    plt.xlabel('epoch')
    plt.ylabel('loss')
    plt.legend(['train', 'test'], loc ='upper right')

    plt.show()


    plot_loss_curve(histroy)
histroy1 = model.fit(X, y, epochs =50, verbose =2 , validation_split = 0.3)
histroy2 = model.fit(X, y, epochs =90, verbose =2 , validation_split = 0.3)
plot_loss_curve(histroy1)
plot_loss_curve(histroy2 )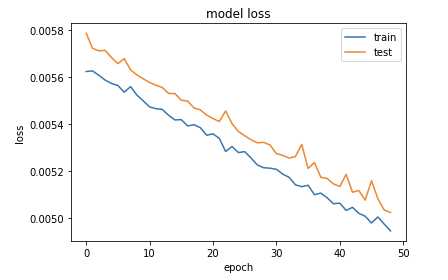
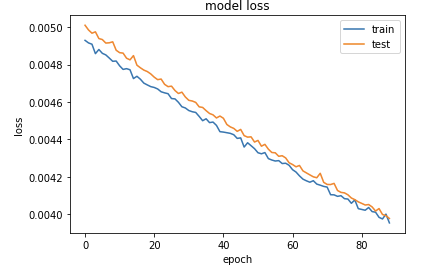

위에서 볼 수 있듯이 epochs 값이 증가함에 따라 loss가 감소함을 볼 수 있다.
따라서 비슷하던 곡선 epoch - loss 곡선도 선형모형에 비슷한 직선으로 변화가 되어가고있다.
또한 sample의 개수에 따른 아래의 그래프 변화를 관찰해보면,
sample의 개수가 증가할 수록 loss의 범위도 작아지게 된다. sample의 개수가 50일때 loss의 범위는 20단위로 140이상까지 증가하게 된다.
하지만 sample 개수가 100개 일때는, loss의 범위가 모두 2 이하로 나타나게 된다.
model = generator_sequential_model()
X1,y1 = generator_linear_regression_dateset(numofsamples = 50)
X2,y2 = generator_linear_regression_dateset(numofsamples = 100)
histroy1 = model.fit(X1, y1, epochs =30, verbose =2 , validation_split = 0.3)
histroy2 = model.fit(X2, y2, epochs =30, verbose =2 , validation_split = 0.3)

plot_loss_curve(histroy1)
plot_loss_curve(histroy2)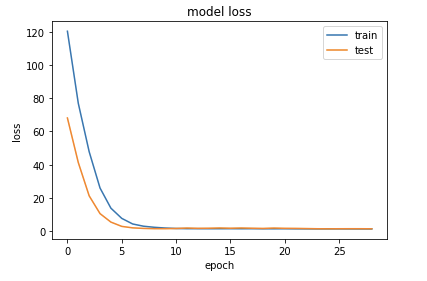
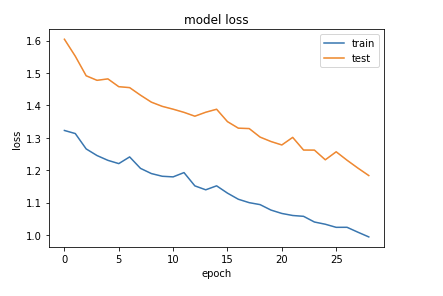
호곡..! 왼쪽의 sample data의 수는 50이고 오른쪽의 sample data의 수는 100이다.
얼핏보면 왼쪽이 더 잘 수렴하는것처럼 보이지만, loss의 크기를 보면 오른쪽이 훨씬 작다는 것을 알 수 있다.
그러면, sample의 개수가 적을때, epochs 값을 증가시키면 어떻게 될까?
model = generator_sequential_model()
X1,y1 = generator_linear_regression_dateset(numofsamples = 50)
histroy1 = model.fit(X1, y1, epochs =20, verbose =2 , validation_split = 0.3)
histroy2 = model.fit(X1, y1, epochs =30, verbose =2 , validation_split = 0.3)
histroy3 = model.fit(X1, y1, epochs =50, verbose =2 , validation_split = 0.3)

plot_loss_curve(histroy1)
plot_loss_curve(histroy2)
plot_loss_curve(histroy3)
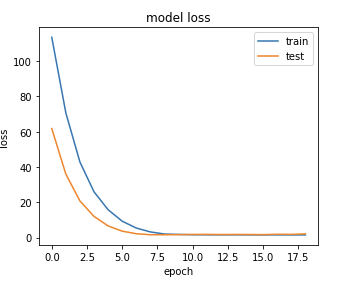

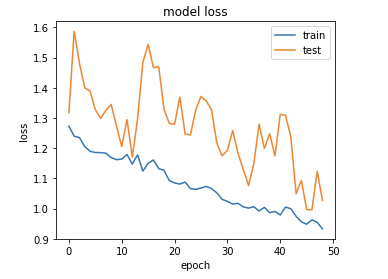
차례대로 history1(sample 20개), history2(sample 30개), history3(sample 50개)의 그래프이다.
위에서 볼 수 있듯이 epoch값이 많으면 많아질수록 loss가 감소한다.
하지만, 일정량이 되면 그 감소 범위도 줄어들게 된다.
그래도 sample data가 많아지는것에비해 epochs만 증가하는 것은 큰 변동(불안정)이 있다.
따라서 sample data를 많이 확보하는것이 정확도를 높일수 있게된다.
따라서 sample개수는 많으면 많을수록 좋다. 왜냐하면 tensorflow는 딥러닝기반
즉, 복잡한 신경망(Deep Neural Network) 기반이기때문이다.
데이터가 많으면 많을 수록 더 좋은 성능을 나타낼 수 있다. (loss 비용 감소)
model = generator_sequential_model()
X1,y1 = generator_linear_regression_dateset(numofsamples = 1000)
histroy4 = model.fit(X1, y1, epochs =50, verbose =2 , validation_split = 0.3)
plot_loss_curve(histroy4)
loss = 0.0423 , val_loss = 0.0408 이처럼 0에 수렴하는 값을 할당받을 수 있다.
이제 예측을 해보겠습니다
[예측 함수]
def predict_new_sample(model, x, w1=3, w2=5, b = 10):

    x= x.reshape(1,2)
    y_pred = model.predict(x)[0][0]

    y_actual = w1*x[0][0] + w2*x[0][1] + b

    print('y actual value = ', y_actual)
    print('y predicted value =', y_pred)
X,y = generator_linear_regression_dateset(numofsamples = 50)
histroy = model.fit(X, y, epochs =50, verbose =2 , validation_split = 0.3)
plot_loss_curve(histroy)
predict_new_sample(model, np.array([0.1,0.2]))
[Out]

X,y = generator_linear_regression_dateset(numofsamples = 300)
histroy = model.fit(X, y, epochs =50, verbose =2 , validation_split = 0.3)
plot_loss_curve(histroy)
predict_new_sample(model, np.array([0.1,0.2]))
[Out]
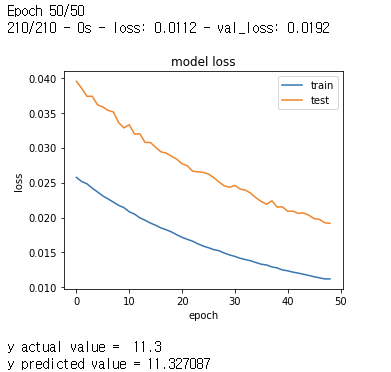
X,y = generator_linear_regression_dateset(numofsamples = 50)
histroy = model.fit(X, y, epochs =20, verbose =2 , validation_split = 0.3)
plot_loss_curve(histroy)
predict_new_sample(model, np.array([0.1,0.2]))
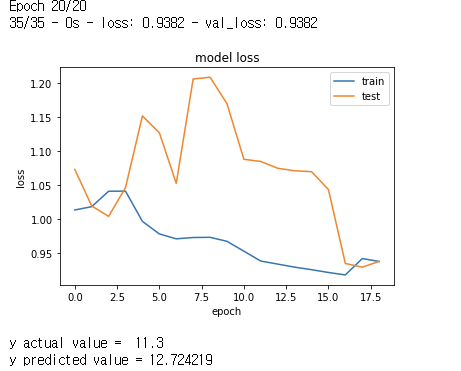
X,y = generator_linear_regression_dateset(numofsamples = 50)
histroy = model.fit(X, y, epochs =50, verbose =2 , validation_split = 0.3)
plot_loss_curve(histroy)
predict_new_sample(model, np.array([0.1,0.2]))

X,y = generator_linear_regression_dateset(numofsamples = 1000)
histroy = model.fit(X, y, epochs =100, verbose =2 , validation_split = 0.3)
plot_loss_curve(histroy)
predict_new_sample(model, np.array([0.1,0.2]))
결론
tensorflow의 keras를 통해 신경망으로 선형회귀문제를 풀었습니다.
실제 값 11.3에 11.209 까지 근접한 값을 얻을 수 있었으므로, 선형회귀문제를 풀었다고 할 수 있습니다.
따라서 이처럼 딥러닝(신경망)으로 선형회귀 문제를 풀 수 있고, 다른 문제들도 풀 수 있다고 합니다.
전제 조건으로는, 학습시키기에 충분한 데이터가 주어진다면 입니다.
따라서, 충분한 데이터가 주어지고 성능이 좋은 컴퓨터가있다면, 딥러닝을통해 많은 머신러닝 문제를 풀 수 있게 됩니다!
전체 코드
import numpy as np
from tensorflow.keras.models import Sequential
from tensorflow.keras.layers import Input, Dense
from tensorflow.keras import initializers

def generator_sequential_model():

    model = Sequential( [
    Input(2, name = 'input_layer'),                             #첫 Layer에서 2개의 변수로부터 값을 받고
    Dense(16, activation = 'sigmoid', name = 'hidden_layer1' ,kernel_initializer =initializers.RandomNormal(mean=0.0, stddev=0.05,seed =42)) , # 뉴런 16개에 전달 , 시그모이드함수 사용
    Dense(1, activation = 'relu', name = 'output_layer',kernel_initializer =initializers.RandomNormal(mean=0.0, stddev=0.05,seed =42))        # 하나의 y값 받아냄
])

    model.summary()
    model.compile(optimizer = 'sgd', loss = 'mse')
    return model


def generator_linear_regression_dateset(numofsamples = 650,w1 = 3, w2 =5, b=10):
    np.random.seed(0)
    X = np.random.rand(numofsamples,2)         # 입력값을 랜덤으로 650개 생성
    coef = np.array([w1,w2])
    bias = b

    y = np.matmul(X,coef.transpose()) + bias
    return X, y

import matplotlib.pyplot as plt

def plot_loss_curve(history):
    plt.figure(figsize = (5,4))

    plt.plot(history.history['loss'][1:])
    plt.plot(history.history['val_loss'][1:])

    plt.title('model loss')
    plt.xlabel('epoch')
    plt.ylabel('loss')
    plt.legend(['train', 'test'], loc ='upper right')

    plt.show()

def predict_new_sample(model, x, w1=3, w2=5, b = 10):

    x= x.reshape(1,2)
    y_pred = model.predict(x)[0][0]

    y_actual = w1*x[0][0] + w2*x[0][1] + b

    print('y actual value = ', y_actual)
    print('y predicted value =', y_pred)


model = generator_sequential_model()
X,y = generator_linear_regression_dateset(numofsamples = 2000)
history = model.fit(X, y, epochs =200, verbose =2 , validation_split = 0.3)
plot_loss_curve(history)

predict_new_sample(model, np.array([0.1,0.2]))

깃허브 : 텐서플로우_신경망이용한_선형회귀모형.ipynb
heonsooo/DataScience_Introduction
2020-2 데이터사이언스개론. Contribute to heonsooo/DataScience_Introduction development by creating an account on GitHub.
github.com
'Make the Learning Curve > Data Science' 카테고리의 다른 글
| [딥러닝] Convolution and Pooling in CNN (0) | 2020.12.12 |
|---|---|
| [딥러닝] Convolutional Neural Network(합성곱 신경망-CNN) 개요 (0) | 2020.12.04 |
| [Deep Learning] What is D/L? 딥러닝이란? (0) | 2020.11.25 |
| K-Means Algorithms (0) | 2020.11.24 |
| [M/L - Classification]Logistic Regression (feat. Linear Regression) (0) | 2020.11.24 |


댓글